SentinelOne’s DFIR capabilities are a standout feature, making it a must-have tool for forensic analysts. Let me walk you through how this tool becomes a forensic heaven for DFIR professionals.
-------------------------------------------------------------------------------------------------------------
Why SentinelOne Excels in DFIR
Imagine you’ve identified an alert—perhaps a hack tool followed by lateral movement. After isolating the endpoint, the question arises:
What’s next?
Deep Analysis Options:
Logs from SentinelOne’s console provide immediate insights.
Use Deep Visibility to explore connections and processes.
Advanced Forensics:Beyond log analysis, SentinelOne allows you to collect:
Entire disk images.
Crucial forensic artifacts like $MFT, $J, Prefetch and more.
This flexibility elevates it above other tools, providing unparalleled forensic depth.
-------------------------------------------------------------------------------------------------------------
I won’t go into details about what the $MFT (Master File Table), $J, Prefetch, Timeline, how to parse it. For an in-depth understanding, you can explore the dedicated Articles available on my website under the "Courses" tab.
Website Link:- https://www.cyberengage.org/courses-1

-------------------------------------------------------------------------------------------------------------
As mentioned earlier,
I promised to explain how to collect and review logs before diving into in-depth forensic analysis. Let’s go over the process for gathering logs.
Collect Logs
Fetching Logs from the Console:

Navigate to Endpoints in SentinelOne.
Select the endpoint you want to investigate.
Click Actions, then select Fetch Logs.
Where to Find Logs:
Wait 5–10 minutes for the logs to upload.
Go to the Activity Tab to download the logs.


What’s Inside the Logs?

When you extract the ZIP file, you’ll find the following:
Sentinel Agent Logs:
Contain information about the endpoint's activities.

Platform Folder:
EventViewer Folder: Includes key logs like:
Application
System
Security
Hardware Event
Kernel Event
Note: SentinelOne does not pull all logs—it focuses on these critical ones.
Misc Folder:
Misc folder contains a wealth of valuable information for Incident Response (IR) professionals. While SentinelOne does not fetch all logs via Event Viewer, the data within the Misc folder can compensate with its extensive details.

-------------------------------------------------------------------------------------------------------------
That's all for logs. I won't delve into log analysis here. If you're interested, I have detailed articles on log analysis using different tools available under the Tool Hub section of my website. These resources will guide you analyzing logs effectively.


-------------------------------------------------------------------------------------------------------------
Now, let’s move on to automation.

In the Automation section, you'll find three tabs: Remote Ops, Task Management, and Tasks.

Let’s begin with Remote Ops to give you a clear understanding of how it works and its relation to the other two tabs.
Remote Ops
Creating a New Operation:Start by clicking the + Create New button.

Selecting an Option:You'll be prompted to choose between uploading a custom script or creating a forensic profile. Let’s explore the Forensic Profile option first.

Creating a Forensic Profile:
You can collect various artifacts, such as registry data, event logs, and even memory dumps.
The platform supports creating forensic profiles for Windows, Linux, and Mac endpoints, which is incredibly versatile.
Once you’ve saved your forensic profile, you’ll see it listed as created and ready for use.

Example outputs for forensic profiles:
Windows: Select and gather registry hives, event logs, and memory images.

Linux: Collect configuration files, log files, and process information.

Mac: Retrieve system logs, kernel events, and user profiles.

Uploading Custom Scripts:
If you already have specific scripts prepared (e.g., using tools like KAPE), you can upload them here for execution. I’ll provide more details about using custom scripts like KAPE later, but for now,
let’s focus on running the forensic profile to demonstrate the output.
Let’s dive into the steps for running a forensic collection, one of my favorite features of SentinelOne. Here’s how it works:
Steps to Run the Forensic Collection
Start the Collection:
Go to the Sentinels Tab in the console.
Select the endpoint you want to investigate.
Click on Actions, then Search for Forensic Collection.
Choose the forensic profile you created earlier and hit Run Collection.

Monitor the Task:

Head over to the Task Tab to track the status.

Initially, it will show as Pending, but within 2–3 minutes, it will switch to In Progress.

Once the collection is complete, you’ll see it listed under the Completed section.
Download the Results:
Click on Download Files to grab the collected data.
Typically, the entire process takes just 10–15 minutes. That’s incredibly fast for a forensic workflow!

What Do You Get in the Output?
When the process completes, you’ll get a wide range of valuable forensic artifacts, including:
$MFT (Master File Table)
$J (Journal)
UserAssist (recent applications used)
Prefetch Files
PowerShell History

In short, you’re handed a complete forensic package—raw and parsed data that’s ready for analysis.
-------------------------------------------------------------------------------------------------------------
Why I Love This Feature
Here’s why I think SentinelOne excels in forensic collection:
You get original, unparsed artifacts like $MFT and $J, which you can analyze deeply.

It also provides parsed data in JSON format, which is great for users who prefer structured outputs.

You’re not limited to Windows—this works seamlessly for Linux and macOS too.
My Personal Take
While I appreciate the JSON files SentinelOne generates, I’ll admit they’re not my favorite format to work with. JSON can be challenging to analyze directly, so I usually stick to my trusted tools like Timeline Explorer and KAPE for parsing and analysis.
For instance, I’ll take the original $MFT file and parse it using KAPE, which makes the data much easier to work with. Similarly, for jumplists and shellbags, I prefer analyzing them manually after extraction.
That said, this feature is a game-changer for anyone comfortable with JSON or text-based formats. If you’re like me and have your favorite tools, you can still extract the raw data and analyze it your way.
-------------------------------------------------------------------------------------------------------------
Running a Script in SentinelOne: Step-by-Step
Now that we’ve covered forensic profiles, let’s move on to running scripts on endpoints. For this example, we’ll use the PSRecon.ps1 script, which is freely available on GitHub:PSRecon on GitHub.
Running scripts through SentinelOne is incredibly straightforward. Here’s how you can do it:
Uploading the Script
Upload the Script:
Navigate to the Automation Tab.
Click + Create New and select Upload New Script.

Give your script a name (e.g., "PSRecon Script") and upload the script file.

Confirm Upload:
Once uploaded, you’ll see the script listed in your repository, ready to be executed.

Running the Script on an Endpoint
Initiate the Script Execution:
Go to the Sentinels Tab and select the target endpoint.
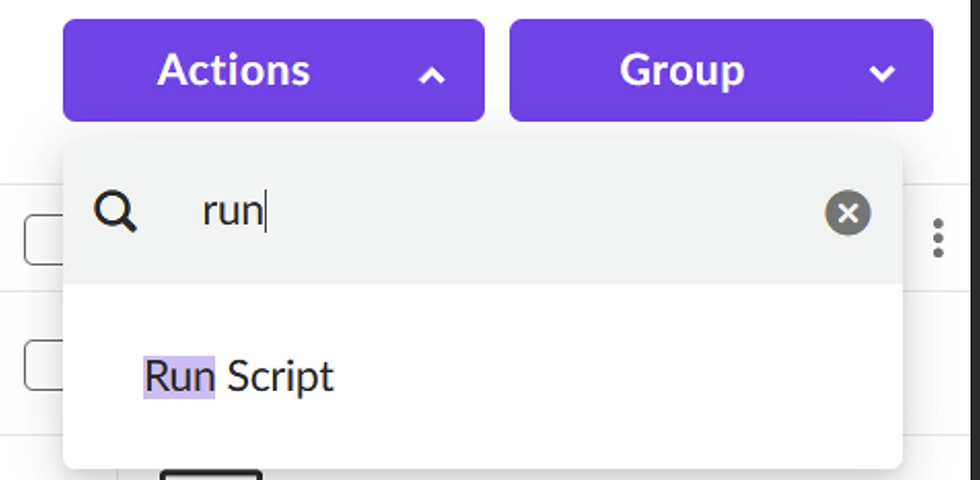
Click on Actions, then Search for Run Script.

Choose the uploaded script from the list.

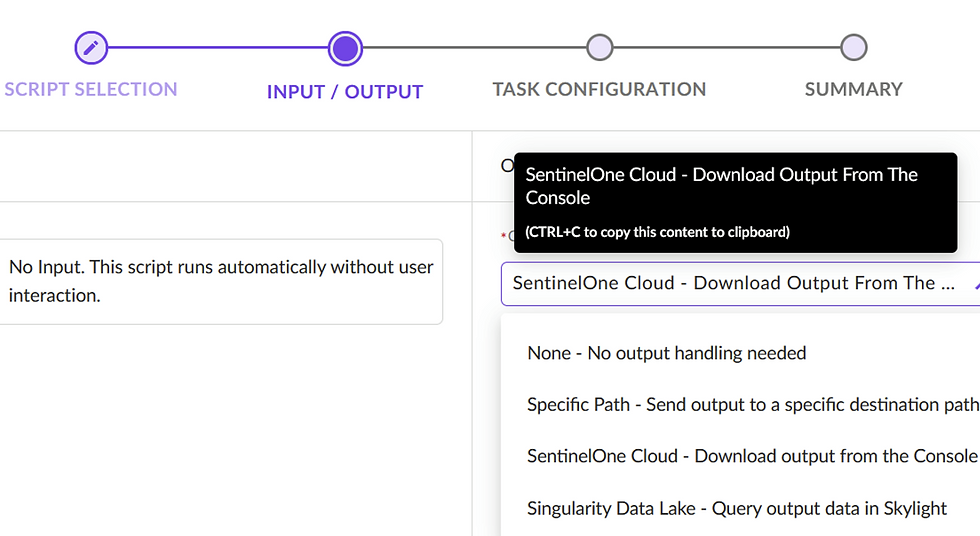
Select Output Location:
Specify where you want the output to be saved.
I recommend always selecting Sentinel One Cloud for easier access and retrieval.


Tracking and Retrieving Output
Monitor the Task:
Head to the Task Tab to check the status of the script.

Initially, it will show as Pending, then move to In Progress.
Retrieve the Output:
Once completed, you’ll find the task listed under the Completed section.
Simply download the output files.

The Result
And that’s it! Within minutes, you’ll have the output generated by your script. For PSRecon, this means detailed system information neatly organized for analysis.

Why This is Amazing
Running scripts like this through SentinelOne is incredibly efficient:
No need for direct access to the endpoint.
Simple, centralized execution.
Automated output retrieval.
It’s a game-changer for incident response and forensic investigations. Whether you’re running PSRecon or any other script, SentinelOne makes it a breeze.
-------------------------------------------------------------------------------------------------------------
Using KAPE with SentinelOne: Step-by-Step Guide
One of my favorite features of SentinelOne is how seamlessly it integrates with tools like KAPE (Kroll Artifact Parser and Extractor).
Let’s dive into how to set this up, whether or not you have an SFTP server for artifact storage.
Overview
In SentinelOne, to run KAPE, you need:
A script to invoke KAPE.
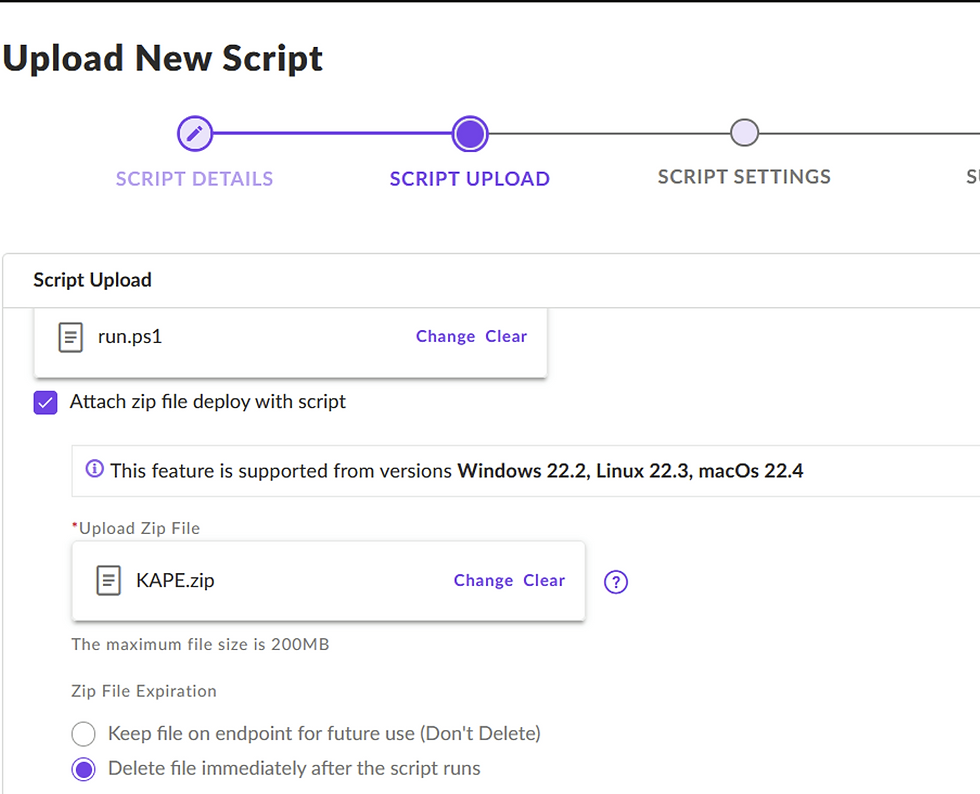
KAPE itself, zipped with the required script.**********(Very Important)*****
Two Scenarios
Without an SFTP Server:Artifacts are stored locally on the endpoint, and you’ll need the client to share the output manually.
With an SFTP Server: Artifacts are uploaded directly to the SFTP server for easy access.
Scenario 1: Without SFTP Server
Script 1: run.ps1
This script invokes another script (NoSFTPserver.ps1) from the SentinelOne environment.

Script 2: invoke.ps1
This script runs KAPE, specifying the collection and output paths.

What It Does:
Runs KAPE using the specified compound or target.
Saves the collected artifacts as a .zip file in C:\output.
Prepare KAPE Package
Place invoke.ps1 inside the KAPE folder.
Zip the entire KAPE folder, including the script.

Upload the Scripts
Go to SentinelOne → Automation → RemoteOps → Upload Script.
Upload the run.ps1 script.


Run the Script
Navigate to Sentinels → Endpoints.
Select the target endpoint.
Go to Actions → Run Script.
Select the run.ps1 script and execute it.
Artifact Retrieval:
The artifacts will be saved in C:\output.(Client Endpoint)
Ask the client to share these files with you for analysis.
Scenario 2: With SFTP Server
If you have an SFTP server, you only need to modify the invoke.ps1 script to include the SFTP upload parameters.
Modified invoke.ps1 Script
Add below parameters in Script:
Additional Parameters:
--scs [server]: SFTP server address.
--scp 22: Port (default is 22 for SFTP).
--scu [user]: Username.
--scpw [pwd]: Password.
-------------------------------------------------------------------------------------------------------------
Why This Is Great
Ease of Use: Uploading and running scripts in SentinelOne is straightforward and efficient.
Flexibility: Works for Windows, macOS, and Linux endpoints.
Customizable: You can use or modify scripts as needed for your specific requirements.
If you want to learn more about KAPE itself, including its detailed functionality, check out my articles under the Tool Hub tab on my website.

-------------------------------------------------------------------------------------------------------------
Automation with SentinelOne: Streamlining Artifact Collection After a Malicious Alert
Imagine this scenario: an attack is detected on a server protected by SentinelOne. With prepared automation, you don't waste a single moment. As soon as the malicious alert is triggered, SentinelOne automatically executes a script like PSRecon or KAPE to collect forensic artifacts.
The Power of Automation in Incident Response
Key Benefits
Time Efficiency: No manual intervention is required to initiate artifact collection.
Complete Artifact Coverage: Immediate collection ensures no critical data is lost or overwritten.
Faster Analysis: You get the artifacts right away for deeper investigation.
Customizable Workflows: You can configure scripts tailored to your investigation needs.
Setting Up Automation in SentinelOne
Step 1: Go to the Marketplace
Navigate to the SentinelOne Marketplace in the console.
Search for the Remote Ops Automation package.
Click Install.


Step 2: Configure the Automation Trigger
Define when the automation should run.
Example: Trigger the automation when an alert is marked as “True Positive.”

Select the script (ID) to be executed.
You can use the psrecon.ps1(ID) script (or any custom script).

Step 3: Specify the Output Location
Output to be available in the Activity Tab of the SentinelOne console.
Scripts can save the output locally (endpoint) or transfer it to an SFTP server, depending on your script configuration. (Like Kape)
Example: PSRecon Automation
How It Works
Malicious Alert Detected: SentinelOne flags a suspicious activity.(Analyst Determined it is true positive and marked the threat true positive)
Automation Triggered: Your PSRecon script automatically runs on the affected endpoint.
Artifacts Collected: All artifacts (like registry, event logs, and more) are gathered without delay.
Output Location: Download the artifacts from the Activity Tab of the console or SFTP server
Results
After automation:
Artifacts are readily available: Download them directly from the Activity Tab.
Faster Analysis: The immediate availability of artifacts speeds up the forensic process, letting you focus on understanding and mitigating the attack.
-------------------------------------------------------------------------------------------------------------
Why SentinelOne is Amazing
The seamless integration of automation with tools makes SentinelOne a game-changer. Instead of wasting time setting up manual artifact collection, everything happens instantly and efficiently.
With SentinelOne, incident response is not just about detection; it's about taking immediate action to gather critical evidence and enabling rapid analysis.
See how awesome this is? Automation + Artifact Collection = Total Control!
-------------------------------------------------------------------------------------------------------------
Stay tuned for the next article, where we’ll dive into last article —a truly exciting topic!
Until then, keep learning and growing. See you soon! 😊
-------------------------------------------------------------------------------------------------------------

Comments